Archive for 2014
Logging Physiological Data | Data Acquisition

Logging subject
data has never been easier than with the advent of wireless subject recording
devices. Quality wireless products allow for accurate readings on a subject’s
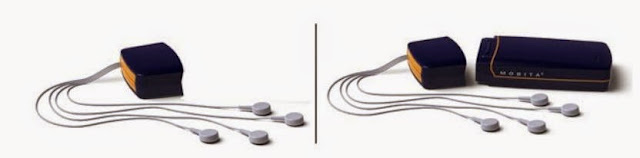
physiology in ways tethered devices cannot. Now with products like the Mobita
wearable biopotential system, data logging is simpler than ever before. Mobita
is a physiological signal amplifier system that can record up to 32 channels of
high-fidelity wireless biopotential data, including ECG, EEG, EGG, EMG, and EOG
data. The Mobita also contains an onboard accelerometer that allows for, along
with AcqKnowledge’s Actigraphy feature, evaluation of a subject’s
activity levels.
 Together with AcqKnowledge software, the system can be
quickly configured to do the work of multiple systems without the added cost of
multiple amplifiers. Simply disconnect one header and
snap on a new configuration for a completely different application. The
system has the option to either log data locally for later download or
telemeter back to a computer running AcqKnowledge for real-time display.
The Mobita can easily switch between either live or logged mode to suit your
research protocol. Using the built-in WiFi telemetry allows for a wide range of
mobile subject recordings. The system has flash disk recording for up to 16 GB
allowing large chunks of data to be stored and kept for back-up. Mobita is also
a very flexible, wearable system due to its technical power and small size. Don’t let the system’s small size and rechargeable battery power operation fool
you—the Mobita has the power to record up to 32 channels at up to 2K s/s and is
fully integrated with AcqKnowledge. The system features a rugged
construction making it well suited for tough and demanding measurement
situations. The Mobita system is sturdy, dustproof, and most importantly is
kept safe in its waterproof enclosure. The Mobita is the premier wireless
biopotential system that is uniquely suited for a variety of applications such
as psychology, neuromarketing, sports, ambulatory testing, and many more. See
Mobita Systems Biopotentials
Together with AcqKnowledge software, the system can be
quickly configured to do the work of multiple systems without the added cost of
multiple amplifiers. Simply disconnect one header and
snap on a new configuration for a completely different application. The
system has the option to either log data locally for later download or
telemeter back to a computer running AcqKnowledge for real-time display.
The Mobita can easily switch between either live or logged mode to suit your
research protocol. Using the built-in WiFi telemetry allows for a wide range of
mobile subject recordings. The system has flash disk recording for up to 16 GB
allowing large chunks of data to be stored and kept for back-up. Mobita is also
a very flexible, wearable system due to its technical power and small size. Don’t let the system’s small size and rechargeable battery power operation fool
you—the Mobita has the power to record up to 32 channels at up to 2K s/s and is
fully integrated with AcqKnowledge. The system features a rugged
construction making it well suited for tough and demanding measurement
situations. The Mobita system is sturdy, dustproof, and most importantly is
kept safe in its waterproof enclosure. The Mobita is the premier wireless
biopotential system that is uniquely suited for a variety of applications such
as psychology, neuromarketing, sports, ambulatory testing, and many more. See
Mobita Systems Biopotentials EEG Data Acquisition
BIOPAC offers a
wide range of tools for recording and analyzing human or animal EEG signals.
Available hardware includes the EEG100C amplifier, which amplifies bioelectric
potentials associated with neuronal activity of the brain and can be used to
perform unipolar or bipolar EEG measurements. The amplifier output can be
switched between normal EEG and alpha wave detection. The 0.005 Hz HP
setting will support Slow Cortical Potential measurement in the EEG. The
Alpha detection mode outputs a smoothed wave with a peak indicating maximal
alpha activity (signal energy in the 8-13 Hz frequency range).
EEG can now
also be recorded from an MRI using the EEG100C-MRI smart amplifier. Data
recording is easier and final results are cleaner when using the smart
amplifier to derive EEG signals during fMRI or MRI. The unit incorporates
advance signal processing to remove spurious MRI artifacts from physiological
data. The MRI version of the EEG100C can still be sampled at the same rate as
the normal amplifier during recording. This is because the MRI related
artifacts are removed from the source, thus still leaving a perfectly recorded
EEG signal.
 The amplifier
includes a number of helpful features that improve derived EEG signals. There
is less sensitivity to electrode and transducer lead placement and improved
gain selectability. The unit minimizes computer based real-time or
post-processing signal processing for faster data analysis. Cleaner data is
available as a real-time analog output for easy analysis. The EEG100C-MRI
contains the same functionality as the normal amplifier with the added
compatibility with MRI cable and filter sets.
The amplifier
includes a number of helpful features that improve derived EEG signals. There
is less sensitivity to electrode and transducer lead placement and improved
gain selectability. The unit minimizes computer based real-time or
post-processing signal processing for faster data analysis. Cleaner data is
available as a real-time analog output for easy analysis. The EEG100C-MRI
contains the same functionality as the normal amplifier with the added
compatibility with MRI cable and filter sets.
AcqKnowledge
provides powerful EEG analysis solutions. Use AcqKnowledge software to
automatically filter raw EEG signal for Alpha, Beta, Theta, and Gamma wave
activity and provide full frequency analysis of the data. AcqKnowledge
contains powerful EEG analysis that provides a fully automated, epoch driven,
analysis of the signal. The software also will remove any EOG artifacts from
the signals.
BIOPAC also
offers a suite of wireless EEG solutions for mobile data recording. The Mobita,
BioNomadix, and B-Alert X10 units all provide powerful wireless recording
alternatives for EEG. The hardware allows for recording of EEG ranging from a
single channel to up to 32 channels of data. Combined with AcqKnowledge
software, the BIOPAC range of EEG recording products encompasses any need for
in-lab recording, real-world and MRI applications. Learn more at EEG
Applications http://www.biopac.com/eeg-electroencephalography
Noninvasive Cardiac Output | Data Acquisition
Noninvasive
Cardiac Output (NICO) measures can be determined by employing electrical
bioimpedance (EBI) measurement techniques. Electrical bioimpedance is the
characteristic impedance of a volume
of tissue and fluid. For Cardiac Output measures, the
relevant tissue includes the heart and the immediate surrounding volume of the
thorax, and the relevant fluid is blood.
The electrical
impedance of the thorax (Zt) can be thought of as composed of two impedance
types:
- The base impedance (Zo) corresponding to non-time varying tissues, such as muscle, bone and fat. Zo is measured when the pulsatile volume is minimal.
- The delta impedance (dZ) corresponding to time-varying fluid volume (blood).
 Zt drops with
each pulsatile volume of blood ejected from the heart. dZ/dt is the magnitude
of the largest impedance change during systole.
Zt drops with
each pulsatile volume of blood ejected from the heart. dZ/dt is the magnitude
of the largest impedance change during systole.
Noninvasive
cardiac output amplifiers incorporate a precision high-frequency current
source, which injects a very small (400 microamp rms) current through the
measurement tissue volume defined by the placement of a set of current source
electrodes. A separate set of monitoring electrodes measures the voltage
developed across the tissue volume. Because the current is constant, the
voltage measured is proportional to the characteristics of the biological
impedance of the tissue volume.
BIOPAC data
acquisition hardware for recording real-time Noninvasive Cardiac Output
parameters include tethered amplifiers such as the NICO100C (or NICO100C-MRI
for fMRI environments), EBI100C, or SS31L, or the wireless BioNomadix BN-NICO.
Hardware
simultaneously measures impedance magnitude and phase, and may
incorporate an internal derivative function to output dZ/dt simultaneously with
Z; an AcqKnowledge calculation channel can also be used to determine
dZ/dt. The internal derivative function inverts the polarity of the dZ/dt
signal so that it displays a positive-going peak, coincident with negative
slopes indicated in Z, as per academic research convention.
Disposable
Ag/AgCl Paired Electrodes (EL500) are recommended for bioimpedance and cardiac
output studies. Paired electrodes provide fixed spacing between the dual
contacts and are pre-gelled with hypo-allergenic, wet liquid gel electrolyte
(10% chloride salt); the gel cavity is situated between electrode and skin
surfaces and helps reduce motion artifact.
The impact of
movement artifacts on recorded data is a significant methodological concern in
impedance cardiography; Ensemble Averaging tools in AcqKnowledge provide
an automated strategy to remove these artifacts. Watch a demo now!
Data Hardware & Software Platforms
Data
acquisition hardware and software requirements vary widely based on experiment
protocol, classroom setup, field studies, etc. BIOPAC data acquisition hardware
platforms support wired, wireless, and fMRI setups, for human or animal
subjects, with powerful, intuitive data software for research and teaching
applications. Use with a variety of amplifiers, stimulators, triggers,
transducers, gas analysis modules, and/or electrodes to acquire life science
signals, including
ECG, EEG, EOG, EMG, EGG, EDA, Respiration, Pulse, Temperature, Impedance
Cardiography, Force, Accelerometry, Goniometry, Dynamometry, Gyro, and more.
Combine data hardware for multi-subject or multi-parameter
protocols.
Research hardware platforms are fully-integrated with AcqKnowledge® data acquisition software, which provides automated routines for data scoring, measurement, and reporting, and can support multiple hardware units. Teaching platforms include Biopac Student Lab software with media-rich tutorial style guide lessons for specified objectives, plus active learning options for student-designed experiments and advanced analysis.
Wired (tethered) data acquisition hardware platforms include the MP150 and MP36R Research Systems. The MP150 16-channel system with universal amplifier provides high resolution (16 bit), high-speed acquisition (400 kHz aggregate) with16 analog inputs and two analog outputs, digital I/O lines (to automatically control other TTL level equipment), and online calculation channels. The MP36R 4-channel research system with built-in amplifiers provides four analog inputs and one analog output, I/O port for digital devices, calculation channels, trigger port, headphone jack, and electrode impedance checker. The MP36R supports software-controlled amplifiers and calculation channels.
Mobita® 32-channel
wearable wireless systems are
ideal for biopotential applications that demand subject mobility and data
logging. The Mobita EEG System uses water electrodes—no skin prep or gels
required. Record live data into AcqKnowledge or log to an internal
storage card for later upload into AcqKnowledge; modes are easily
switched to suit specific protocols.
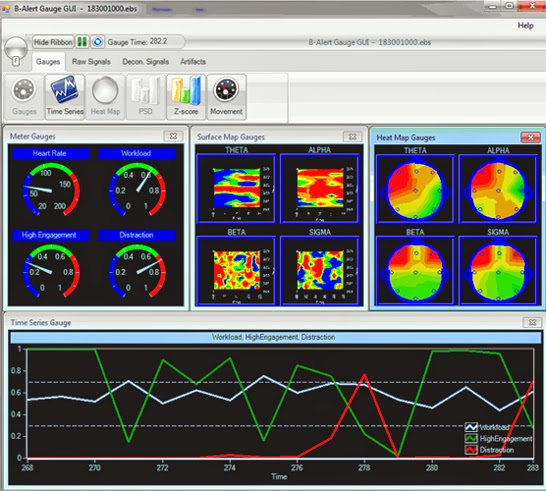
 B-Alert
X10® Wireless Systems
provide nine channels of high fidelity EEG plus ECG, and data software
for cognitive state metrics software is available. The stand-alone system easily
interfaces with MP150 Research System to synchronize with other physiological
data.
B-Alert
X10® Wireless Systems
provide nine channels of high fidelity EEG plus ECG, and data software
for cognitive state metrics software is available. The stand-alone system easily
interfaces with MP150 Research System to synchronize with other physiological
data.
BioHarness® with AcqKnowledge is a lightweight, non-restrictive data logger and telemetry system to monitor, record, and analyze a variety of physiological parameters, including ECG, respiration, posture, and acceleration.
 Stellar®
Small Animal Telemetry
Licenses with AcqKnowledge
control wireless data acquisition
from Stellar Implantable Telemetry Systems. The
easy-to-configure Animal Scheduler works for a subset or complete group of
conscious, unrestrained small animals for long term recordings.
Multiple
display modes can be viewed simultaneously, and signal conditioning tools (e.g.,
filtering and artifact removal) can be
applied.
Stellar®
Small Animal Telemetry
Licenses with AcqKnowledge
control wireless data acquisition
from Stellar Implantable Telemetry Systems. The
easy-to-configure Animal Scheduler works for a subset or complete group of
conscious, unrestrained small animals for long term recordings.
Multiple
display modes can be viewed simultaneously, and signal conditioning tools (e.g.,
filtering and artifact removal) can be
applied.
These and other BIOPAC data hardware and software solutions are used in thousands of labs worldwide and cited in thousands of publications. Learn more about research systems and teaching systems.
Research hardware platforms are fully-integrated with AcqKnowledge® data acquisition software, which provides automated routines for data scoring, measurement, and reporting, and can support multiple hardware units. Teaching platforms include Biopac Student Lab software with media-rich tutorial style guide lessons for specified objectives, plus active learning options for student-designed experiments and advanced analysis.
Wired (tethered) data acquisition hardware platforms include the MP150 and MP36R Research Systems. The MP150 16-channel system with universal amplifier provides high resolution (16 bit), high-speed acquisition (400 kHz aggregate) with16 analog inputs and two analog outputs, digital I/O lines (to automatically control other TTL level equipment), and online calculation channels. The MP36R 4-channel research system with built-in amplifiers provides four analog inputs and one analog output, I/O port for digital devices, calculation channels, trigger port, headphone jack, and electrode impedance checker. The MP36R supports software-controlled amplifiers and calculation channels.
Wireless data
hardware includes options for live or logged data:
BioNomadix
wireless, wearable physiology monitoring devices noninvasively record
high-quality, full-bandwidth data while comfortably allowing subjects to move
freely in natural indoor environments. Digital transmission and transducers
placed close to the signal source provide excellent signal quality. Record
up to 16 channels of BioNomadix data with a BIOPAC MP150 System—the system also
works with multiple MP150 systems or third-party data acquisition hardware via
an isolated power supply module.
B-Alert
X10® Wireless Systems
provide nine channels of high fidelity EEG plus ECG, and data software
for cognitive state metrics software is available. The stand-alone system easily
interfaces with MP150 Research System to synchronize with other physiological
data.BioHarness® with AcqKnowledge is a lightweight, non-restrictive data logger and telemetry system to monitor, record, and analyze a variety of physiological parameters, including ECG, respiration, posture, and acceleration.
These and other BIOPAC data hardware and software solutions are used in thousands of labs worldwide and cited in thousands of publications. Learn more about research systems and teaching systems.
Biomechanics Transducers | Data Acquisition
Biomechanics
data can include measures of force and motion of body position, posture, and
joint movement over a wide range of static and dynamic conditions. Biomechanics
measurements are meaningful for a wide variety of research applications, such as
biomedical engineering, exercise physiology, sports training or rehab, and
ergonomics (for characteristics of a specific work activity or environment).
Biomechanics transducers include goniometers, torsiometers, and
accelerometers. Transducers are unobtrusive and lightweight, and can be worn
comfortably and undetected under clothing or attached to external
equipment—leaving the subject to move freely in the normal
environment.
Biomechanics transducers connect directly to the BIOPAC Acquisition Unit as part of an MP or BSL System. For a more complete physiological analysis, additional signals can be recorded (e.g., EMG, respiration, heart rate) and video data can be tightly-synchronized for a clear and detailed view of the biomechanics of a movement with the subject’s physiological data.
Goniometers incorporate gauge elements that measure bending strain along or around a particular axis and transform angular position into a proportional electrical signal. The gauge mechanism allows for accurate measurement of polycentric joints. As the joint moves through a determined angle, the relative linear distance between the two mounting positions will change. A telescopic endblock prevents the measuring element from becoming over-stretched or buckled as the limb moves. The bending strain is proportional to the sum total angular shift along the axis. Because the bending force is extremely small, the output signal is uniquely a proportional function of the angular shift.
 Twin-axis goniometers measure rotation about two orthogonal planes
simultaneously to record limb angular movement, such as adequate bending in the
elbows or knees, unsafe rounding in the lower spine, wrist or ankle
flexion/extension, abduction/adduction, radial/ulnar deviations, etc.
Single-axis goniometers measure the angle in one plane only and are used to
record digit joint movement of fingers, thumb or
toes.
Twin-axis goniometers measure rotation about two orthogonal planes
simultaneously to record limb angular movement, such as adequate bending in the
elbows or knees, unsafe rounding in the lower spine, wrist or ankle
flexion/extension, abduction/adduction, radial/ulnar deviations, etc.
Single-axis goniometers measure the angle in one plane only and are used to
record digit joint movement of fingers, thumb or
toes.
Torsiometers measure rotation about a single axis (e.g., forearm pronation/supination) to record angular twisting (as opposed to bending) of the torso, spine or neck.
Tri-Axial Accelerometers are high level output transducers that provide three outputs to measure acceleration along the X-, Y- and Z-axes simultaneously. To reliably record head tilt, place an accelerometer on the head. To measure accelerations when performing slow movements, such as walking and hand tremor, ±5 G accelerometers are optimal; ±50 G are more suitable for quick movements, such as swinging a tennis racket.
For applications where quick or rapid movements are involved, fit a “sock” bandage over the whole sensor and interconnect lead. For accurate results from long recordings, use double-sided adhesive between the endblocks and skin, and place single-sided adhesive tape over the top of the endblocks. No tape should come into contact with the spring. The connection lead should also be taped down near the sensor element.
Biomechanics transducers connect directly to the BIOPAC Acquisition Unit as part of an MP or BSL System. For a more complete physiological analysis, additional signals can be recorded (e.g., EMG, respiration, heart rate) and video data can be tightly-synchronized for a clear and detailed view of the biomechanics of a movement with the subject’s physiological data.
Goniometers incorporate gauge elements that measure bending strain along or around a particular axis and transform angular position into a proportional electrical signal. The gauge mechanism allows for accurate measurement of polycentric joints. As the joint moves through a determined angle, the relative linear distance between the two mounting positions will change. A telescopic endblock prevents the measuring element from becoming over-stretched or buckled as the limb moves. The bending strain is proportional to the sum total angular shift along the axis. Because the bending force is extremely small, the output signal is uniquely a proportional function of the angular shift.
Torsiometers measure rotation about a single axis (e.g., forearm pronation/supination) to record angular twisting (as opposed to bending) of the torso, spine or neck.
Tri-Axial Accelerometers are high level output transducers that provide three outputs to measure acceleration along the X-, Y- and Z-axes simultaneously. To reliably record head tilt, place an accelerometer on the head. To measure accelerations when performing slow movements, such as walking and hand tremor, ±5 G accelerometers are optimal; ±50 G are more suitable for quick movements, such as swinging a tennis racket.
For applications where quick or rapid movements are involved, fit a “sock” bandage over the whole sensor and interconnect lead. For accurate results from long recordings, use double-sided adhesive between the endblocks and skin, and place single-sided adhesive tape over the top of the endblocks. No tape should come into contact with the spring. The connection lead should also be taped down near the sensor element.
End the Complications of Data Acquisition Hardware

Data
Acquisition and analysis for the life sciences has improved immensely from the
days of chart recorders and oscilloscopes. Remember when data had to be scored
by hand, and marked and measured with a ruler? The old technology of the past
has given way to sophisticated
data acquisition hardware and data
acquisition software platforms of the present day that allow researchers to
record, display, and analyze data intuitively with easy-to-use hardware and
simple pull-down software menus.
Data
Acquisition hardware is no longer complicated equipment, full of knobs, dials
and switches — rather it is easy to use, flexible and available for a wide
range of application areas. Wireless
data acquisition hardware allows of recording of mobile or ambulatory
subjects in real world environments or virtual reality paradigms. Data can be
streamed live or logged to an internal storage for later upload. Data
acquisition hardware is also available for specialty applications like fMRI,
now researchers can record
physiology in the MRI to examine subject responses during functional
magnetic resonance imaging tests.
After
acquiring physiological data, researchers can use data acquisition software
with automated analysis
routines to mark, score, and output results from the data. Data acquisition
software is intuitive and feature rich, with real-time display options,
real-time calculation channels, and post acquisition analysis tools including
cycle detectors, rate calculators, frequency and power analysis and specific
automated analysis routines for signals such as ECG, EMG, EEG, Blood Pressure,
ICG, EDA, and more!
Wireless Surface EMG Modules | Data Acquisition
Physiological
data acquisition systems offer many options for recording surface EMG, needle
EMG, and fine wire EMG. General muscle activity and fatigue can be determined
by recording and analyzing surface EMG data from major muscle groups.

Correlate
EMG activity with data from other sources including force plates, goniometers,
and motion analysis equipment. Analysis software
tools, including spike counting, muscle activation location, and frequency
analysis allow for post-acquisition surface EMG data interpretation. Results of
EMG recordings can be output as graph channels for easy data visualization, or
can be in numerical format in summary tables or spreadsheets. Data can then be
used for further statistical analysis.
EMG Analysis | Biomechanics
Biomechanics
research has never been easier thanks to powerful new data acquisition and
analysis tools. Perform real-time calculations and post-data acquisition
analysis on a variety of biomechanical and physiological data.
Simultaneously
acquire up to 16 channels of biomechanics and/or gait-specific data. An example
setup could incorporate two channels of heel/toe
strike timing, ten channels of EMG signals, and
four channels of goniometry data — however combinations are virtually endless.
Record sit-and-reach tests, range of motion evaluations, muscle balance
assessments and more.
Real-time
event markers allow researchers to log important events in the data and also
include comments that can be written during or post acquisition.
After
recording, choose an automated
analysis package to interpret and score the biomechanics data. For example,
automated EMG
analysis allows for a variety of automated functions including deriving
integrated EMG, root mean square (RMS) EMG, locating muscle activation, full
frequency and power analysis, and much more.
Electrocardiogram Signals | ECG Analysis
 Electrocardiogram signals can be recorded
from humans or animals wirelessly or via tethered amplifiers(BioNomadix). Analyzing changes
in ECG rhythms can provide valuable insight into stress, arousal, and exercise
research. Automated ECG Analysis
packages are available that provide a wide variety of automated ECG analysis
options.
Electrocardiogram signals can be recorded
from humans or animals wirelessly or via tethered amplifiers(BioNomadix). Analyzing changes
in ECG rhythms can provide valuable insight into stress, arousal, and exercise
research. Automated ECG Analysis
packages are available that provide a wide variety of automated ECG analysis
options. To examine changes in the physical ECG complex during experimental protocols the Locate ECG Complex boundaries routine will locate and score the different parts of the ECG complex (P, Q, R, S, T intervals). The routine can be tailored for human or animal ECG recordings. For human signals, the automated ECG complex boundaries routine can also measure and extract the ECG interval information to a spreadsheet file or text file. Another automated ECG analysis routine will help the user classify heartbeats as normal, PVC, or unknown. This provides a quick automated analysis tool to identify and mark irregular heartbeats.

Additional automated ECG analysis tools are
also available to examine respiratory sinus arrhythmia, determine beat-by-beat
heart rate, and more.
Neuromarketing Solutions | Data Acquisition
Neuromarketing solutions are available that allow you to examine physiological responses to products, environments, other stimuli or decision making tasks. Multiple physiological signals can be recorded and analyzed for Neuromarketing, including EEG. EEG analysis options allow for understanding of the subject's cognitive state for a variety of Neuromarketing tasks. Gauging level of engagement, workload and drowsiness while performing tasks or participating in consumer test situations can provide valuable insight into product development and marketing. Neuromarketing solutions should be as unobtrusive as possible, allowing for wireless EEG and other physiological signals to be recorded and analyzed from mobile subjects. Whether subjects are in a lab or real-world environment, users should have the ability to stream physiological data live or record and log up to 32-channels of high-quality biopotential data.
For some applications, long-term activity studies may be necessary. Solutions are available that allow users to monitor subjects in their home environment over multiple hours or days. For example, record ECG, EEG, Respiration, EMG, and GPS positioning data to look at overall activity levels and physiological responses to different Neuromarketing stimuli and daily activities that include product interactions.
Virtual Reality & Neuromarketing
Immersive
virtual reality environments can unlock physical boundaries and budget limits.
Applications
for VR protocols are varied and include Psychology, Ergonomics, Neuromarketing
& Neuroeconomics (Consumer Research), Biomechanics & Kinesiology,
Healthcare, Computer Modeling/Simulation, Education, and Training: hazard,
medical, etc.

Researchers
can immerse subjects in a VR world and record physiological data as the virtual
environment influences the subject. A feedback loop can be included for greater
control and automation of the VR world. This allows the world to change in real
time, based on the subject’s responses. Timing events are used for analysis of
the physiological data. Eye tracking can be added to the headmounted VR display
to track the subjects’ eyes as they view the immersive environment during the
experiment, and position tracking can also be included.
Wireless
transmitters, EEG caps, and eyetrackers have been used to capture data from
mobile subjects in actual environments, but virtual reality expands the research
potential by allowing participants to be immersed in variable, simulated
environments with an incredible degree of realism. For instance, neuromarketers
can allow subjects to smell and feel multiple products and move through
different display configurations, or psychologists can choose appropriate
environments to study phobias such as flying or public
speaking.
At the
first Neuromarketing World Forum
(2012, Amsterdam), the
challenge and potential of enhancing market research with neuromarketing tools
was discussed, and virtual reality immersive techniques were recognized as
valuable tools for measuring affective states while modifying product
presentation. The value of capturing
synchronized physiological data
(heart rate, HR, ECG, EDA), brain
response (EEG,
fMRI, fNIR), and behavior metrics
(eye tracking, position tracking) was also discussed.
Turnkey
VR/ Immersive systems from BIOPAC are easily combined with wireless physiology
data to synchronize VR events with physiological response data. Neuromarketers
and other researchers can record any combination of signals (ECG, EEG, EOG, EMG,
EGG, EDA, temperature, respiration, pulse, etc.) and include multimodal
stimulation with visual, auditory, olfactory, haptic, or electric stimulus.
Remote Monitoring options provide subjects with a greater degree of freedom and
allow them to move around within the virtual world.
Muscular Biofeedback | Surface EMG

Biofeedback
is
a form of self-regulation in which an individual is provided information in the
form of sensory feedback about a biological condition or function in order to
gain control over that biological function. Biofeedback is often used as a
therapeutic tool by which sports medicine/rehabilitation professionals,
neurophysiologists, psychophysiologists, and therapists can use
electrophysiological instrumentation to measure, process, and “feedback” the
recorded information to the participating athlete or subject. The feedback is
usually provided through auditory and/or visual means.
There
are many types of biofeedback modalities available. One of the most popular and
widely accepted modalities is surface
EMG biofeedback. EMG (electromyography) bioinstrumentation measures
muscle activity by recording electrochemical activity of a muscle occurring
during depolarization and recruitment of a skeletal muscle motor unit. This
modality is used for muscle
reeducation and control when
orthopedic injuries or surgeries have taken place, or when the peripheral
nervous system has been impaired. It is also used to promote muscle relaxation
to decrease muscle guarding, pain, stress, and anxiety.
A
simple muscular biofeedback experiment design might use surface EMG electrodes
placed over the Vastus Medialis and Vastus Lateralis muscles. Surface EMG
electrodes should be placed vertically (parallel to the muscle fibers), over the
muscle belly, or largest part of the muscle, and a ground electrode should also
be used. Surface EMG should be recorded in several trials, including a Baseline
without biofeedback (where the participant is asked to maximally relax, e.g.,
not contract), Maximal Contraction
without Biofeedback, and a variety of Maximal Contraction with Biofeedback, such as
visual stimulus or auditory stimulus. After recording, compare the
surface EMG recordings and use peak-peak and mean measurements to determine if
any significant change was detected between any of the variables.
Biofeedback
is considered advantageous, as it provides participants a chance to use their
visual and auditory senses to become more aware of how they are performing
during therapy or training, attempt to improve upon it, and immediately see the
improvement as it is occurring. Because participants can immediately note
improvements, they are “rewarded.” This reward will hopefully lead to larger
improvements and accomplishments.
The Body Electric | Surface EMG
Electricity
is part of everything the body does.
 Surface EMG electrodes noninvasively record the electrical activity of skeletal
muscles. The unit of measure for the electrical activity is the volt, which is named after Count
Alessandro Volta (who also invented the battery). The detection, amplification,
and recording of changes in skin voltage produced by underlying skeletal muscle
contraction is called electromyography;
the recording thus obtained is called an electromyogram (EMG).
Surface EMG electrodes noninvasively record the electrical activity of skeletal
muscles. The unit of measure for the electrical activity is the volt, which is named after Count
Alessandro Volta (who also invented the battery). The detection, amplification,
and recording of changes in skin voltage produced by underlying skeletal muscle
contraction is called electromyography;
the recording thus obtained is called an electromyogram (EMG).
Electricity
is always flowing in the body; it flows from negatively charged parts of the
body to positively charged parts. As this electricity flows, surface EMG (sEMG)
electrodes can detect and monitor the electrical activity.
Surface EMG electrodes noninvasively record the electrical activity of skeletal
muscles. The unit of measure for the electrical activity is the volt, which is named after Count
Alessandro Volta (who also invented the battery). The detection, amplification,
and recording of changes in skin voltage produced by underlying skeletal muscle
contraction is called electromyography;
the recording thus obtained is called an electromyogram (EMG).
Skeletal
muscles are stimulated to contract by somatic motor nerves that carry signals
in the form of nerve impulses from the brain or spinal cord to the skeletal
muscles. Although a single motor neuron can innervate several muscle fibers,
each muscle fiber is innervated by only one motor neuron. The combination of a
single motor neuron and all of the muscle fibers it controls is called a motor
unit. When a somatic motor neuron is activated, all of the muscle fibers it
innervates respond to the neuron’s impulses by generating their own electrical
signals that lead to contraction of the activated muscle fibers.
Integrated EMG “averages out” noise spikes in the raw EMG
data to provide a more accurate indication of the EMG output level
Muscle activation,
strength, fatigue, or twitch can be
monitored with surface EMG electrodes from a variety of body locations
to study Gait, Range of Motion, Isometric and Isotonic Contraction, Ergonomics,
startle response, etc. sEMG data can be
combined with other data to display muscle response simultaneously with other
physiological events.
Neuromarketing and Neuroeconomics | Data Acquisition

Physiological signals for macroeconomic or micromarketing analysis can be recorded almost anywhere, including: the lab, during fMRI, a workplace environment, virtual reality scenarios, in a subject's home, or mobile application. Wireless data systems allows participants to move and respond freely.
 A wide range of recording options can ensure quality data collection in a comfortable and unobtrusive manner to seamlessly capture the most important events in a neuromarketing and neuroeconomic study.
Examine responses to stimuli or decision making tasks in the brain with EEG or fNIR data. Analyze cognitive state, level of engagement, workload and drowsiness while subjects participate in a consumer test, perform a task, watch a presentation, etc.
Record a variety of biometrics to examine stress and arousal to specific stimuli, such as facial EMG, ECG/Heart Rate, skin conductance level (EDA/GSR), or respiration.
Combine eye tracking data with other physiological variables to provide context for the subject's emotional response to certain types of stimulation.

Synchronize with video to visually correlate subject’s behavior with the data...replay the video and see what the subject was doing at key points during neuromarketing study. Synchronize with GPS data to better understand a subject’s lifestyle. Create reports that classify specific and non-specific response events to specific stimuli results from automated scoring and analysis software that helps to measure, score, and output experiment results.
For more information and products surrounding this topic, follow through to BIOPAC.com.
Wireless Physiology | Data Acquisition

Research and education in the life sciences often benefits from the use of monitoring devices in which the subject being tested can move freely. BIOPAC now offers a multiple parameter ambulatory monitoring system—the BioNomadix series of wireless physiological monitoring devices.
BioNomadix
are high-quality, wireless monitoring devices that appeal to users who value
the level of accuracy that comes with wired systems, but are searching for a
data acquisition solution that enables the researcher to collect data from a
subject conducting procedures that require ample space and frequent motion.
The
BioNomadix series not only enables researchers to record high-quality data in
situations where a wired device would be limiting, it also brings comfort and
freedom to the subject. With activities such as exercising and other
high-movement tasks, the lack of wires allows the subject to conduct real-life
motions without obstruction or discomfort.
The
devices consist of a subject-worn transmitter and a receiver module.
Transmitters easily attach to any location and are used with additional leads
or transducers—short leads allow placement close to the signal source to ensure
excellent data quality. A custom, stretch mesh shirt allows multiple devices to
be worn comfortably by the subject at one time.
BioNomadix
dual-channel devices can collect data from an array of physiological signals
and signal combinations including:
ECG Dynamometry Impedance Cardiography (NICO)
EEG Respiration Electrodermal Activity
EOG Pulse Accelerometry
EMG Temperature Gyroscope
EGG Dual Strike (Heel/Toe) Goniometry/Torsiometry
Each
device is configured for the specific physiological signal type to help ensure
high-quality data at full bandwidth.
BioNomadix
wireless data sets are the latest addition to data acquisition and analysis
systems from BIOAPC that are used in thousand of labs worldwide and cited in
thousands of peer-reviewed publications.
If
you are looking for a physiological monitoring device that allows movement,
comfort and variability while still maintaining the quality, integrity and
excellence of wired devices, BIOPAC’s BioNomadix series is key to your
research.
MP150 Data Acquisition Software

AcqKnowledge is the next generation in data acquisition and analysis.
With BIOPAC Systems’ MP System and AcqKnowledge acquisition software, research is more efficient than ever. Record, organize, manage and analyze data easily with AcqKnowledge’s intuitive interface and updated features.
The MP150 Data Acquisition System includes:
- Ethernet-ready data acquisition and analysis
- Ability to record multiple channels with differing samples rates
- Function to record at speeds of up to 400 kHz (aggregate)
AcqKnowledge provides numerous video tutorials which allow you to spend less time learning the software and more time recording and analyzing data. Additionally, the system can be placed in your local area network (LAN), and you can use any PC in the LAN to record from any MP150 system in the network.
AcqKnowledge Benefits and Features
BIOPAC MP150 Systems utilize AcqKnowledge software. Some of the major benefits of AcqKnowledge acquisition software include:
- Improved lab efficiency
- Enhanced security and data integrity
- Configurable user interface
- Standard Operating Procedure (SOP) template options
New for AcqKnowledge Version 4.3
The latest version of AcqKnowledge includes several exciting updates which have made the software even more easy to use than before.
Focus Areas – This feature simplifies and standardizes data analysis by allowing you to analyze data in selected regions, as well as use it with the most automated analysis routines and the Find Cycle Detector. When you set up focus areas, you can individually label them and search for cycles on these specific regions. The focus areas can then be downloaded into separate spreadsheets. For example, when conducting automated blood pressure analysis, you can download the search baseline, test phase and recovery period focus areas separately.
Channel Specific Grid Functionality – When using grids within a data file, the grids can be enabled or disabled for different graphs. For instance, if you need a different grid for ECG and Alpha EEG waveform on the same graph, you can adjust and customize each grid. This new tool also allows you to save graph templates and presets for future use.
Linked Acquisitions – Linked Acquisitions allows you to record from multiple MP150s, MP36Rs, B-Alert Headsets and BioHarness. You can choose from multiple synchronization methods and specify whether or not to create a merged data file at the end of recording. The merged data file then will contain all of your channels of data from each recording, with independent data files for each device.
Locate Animal ECG Complex Boundaries – This new system locates and marks animal ECG complex boundaries, and functions the same way as the Locate Human ECG Complex Boundaries. However, this feature is optimized for the faster heart rates of small animals. To use the Locate Animal ECG Complex Boundaries, simply enter in the average heart rate for the file, run the routine locater and mark the ECG complex boundaries.
New Preset Options – Presets help save time on recording and analysis. Rate, expression and box configuration presets are available for both calculation channel set-up and offline analysis. When using this feature, you simply specify the number of horizontal and vertical measurement boxes desired, and then save as a preset for future use.
New User Interface Features – Version 4.3 includes many new user interface features, including tabbed window display (multiple tabs containing different tab files), textual value toolbar, selection palette enhancements, linked selections, autoscale single waveform, configure number of horizontal measurements, remove annotations from a single channel and journal docking location preference.
Pressure-Volume Loop Analysis – Baseline analysis is useful for looking at immediate drug delivery effects and when positioning a catheter. The pressure-volume loop analysis feature includes a preconfigured QuickStart template which helps you start recording quickly, and enables you to analyze pressure-volume loops data from anesthetized animals. This tool lets you easily pause recordings and run a quick baseline analysis during use, and features an intuitive loop graph display with a built-in text table.
Learn More About MP150 Data Acquisition Software
If you are interested in learning more about how the MP System and AcqKnowledge acquisition software can help you work faster and smarter, please contact BIOPAC Systems.
BIOPAC is dedicated to developing innovative, high quality and competitively priced life sciences educational and research hardware and software designed to meet customers’ needs.
Heart Rate Variability
What
is Heart Rate Variability?
Heart
rate variability studies examine alterations in the interval between heart
beats. Several physiological variables can affect the normal rhythm of the
heart and the interaction between the sympathetic and parasympathetic nervous
systems.
Heart
rate fluctuates based on a variety of conditions and can indicate the presence
of disease or forewarn impending cardiac diseases. These indicators may always
be present but sometimes may only occur occasionally at specific
times throughout the day. Heart rate is monitored to assess the
health of a subject or the significance of heart abnormalities. Data
acquisition of this caliber can have profound advancements in the way heart
conditions are understood and treatments are developed.
Monitoring
heart rate variability may be time consuming and difficult without the right
tools in place.
How
heart rate variability works
The
base of your heart rate is located in the
sinoatrial (SA) node of the heart. In this node, cells continuously generate an
electrical impulse which is spread through the entire heart muscle, causing a
contraction. The number of electrical impulses generated per minute is
equivalent to the heart beats per minute.
The autonomic nervous system largely controls the heart rate and
rhythm of the heart, and is broken down into two separate areas: the
parasympathetic nervous system and the sympathetic nervous system.
The parasympathetic nervous system affects the heart rate
through the release of acetylcholine by the vagus nerve. This can impede
activation of SA node activity and may also decrease HRV.
The sympathetic nervous system impacts the heart rate through a
release of epinephrine and norepinephrine. This usually increases activity of
the SA node and may increase HRV.
How
BIOPAC fits in
When
performing heart rate variability analysis, the importance of recording proper
data can not be overstated.
"Results
reveal that even a single heart period artifact, occurring within a 2-min
recording epoch, can lead to errors of estimate heart period variability that
are considerably larger than typical effect sizes in psychophysiological
studies."
—Berntson
& Stowell, 1998
AcqKnowledge Electrocardiogram(ECG) Routines
What is an ECG?
An ECG - or electrocardiogram – is a common test used to gauge heart health. It monitors the electrical activity of the heart, which can indicate problems related to heart rate and valve health. Other reasons an ECG may be performed are to:
- Check how the heart responds to exercise (as with a classic treadmill test)
- See if the walls of the heart chambers are hypertrophied
- Discover the cause of specific symptoms of heart disease
- An ECG calculates a wide range of valuable data valuable including:
- Heart Rate
- Heart Rhythm
- Evidence of previous heart attacks
- Possibility of coronary artery disease
- Signs of decreased oxygen to the heart
The main types of ECG are:
Cardiac stress test - this one is recorded while the subject is active, usually walking on a treadmill or riding on an exercise bike. The typical time for this test is 15-30 minutes.
Ambulatory - This ECG test is done using a transportable recording device, often called a data logger, that is worn for 24 hours or more, with the subject free to move around in a normal fashion. This type of test is typically used to study infrequent symptoms that might not show up in a resting ECG test. The subject is usually asked to keep track of his/her own symptoms in a journal of some kind, keeping track of the time of each symptom to be later compared to the results of the ECG test.
Resting - This is the most common ECG test and is taken while the subject is lying down for usually 5-10 minutes. Subjects are instructed to keep as still as possible to avoid other muscle activity interfering with the activity of the heart.
Some possible limitations of an ECG test include:
Some irregularity surfacing through the test are false positives, often times not having any medical importance after further assessment is done.
The test can also show up negative for subjects with some form of heart disease including diagnosed coronary artery disease.

BIOPAC's ECG data acquisition software
AcqKnowledge includes the following automated ECG routines, as well as numerous other automated analysis routines and transformation tools:
Locate Human ECG Complex Boundaries
Heart Rate Variability
Personalize your package with specialized amplifiers, leads, electrodes, and/or transducers. Have the ability to record the max of 16 channels of high-fidelity ECG and additional physiological data either wirelessly with BioNomadix or via standard wired amplifiers.
Contact BIOPAC today for more information.