Showing posts with label data acquisition. Show all posts
Wireless | Testing VO2 Max

Cardiovascular tests during a self-paced maximal exercise protocol (SPV) continually scored high ratings of VO2 max when compared to more traditional procedures. Jenkins et. al sought to understand the underlying causes of this increase in VO2 max by testing SPV versus the more regimented RAMP method. They sought to explore the results through extensive physiological measurement, as well as testing difference in older and younger age groups, while participants completed physical experiments.
The SPV protocol was completed on an air-braked cycle ergometer, which allowed participants to continually vary their Power Output (PO) throughout the test. An electro-magnetically braked cycle ergometer was used for the RAMP protocol, so that PO was fixed for each stage of the incremental RAMP protocol.
VO2 Max is essentially the maximum amount of oxygen utilized during a workout. Forty-four (44) male and female participants completed the experiment, half aged between 18- 30 and half between 50-75. The participants completed each test over a multi-day period. The tests were exhaustive, requiring subjects to cycle in place until they couldn’t any longer.
Jenkins et. al recorded various physiological signals including NIRS, breathing/expired gases, cardiac output/ stroke volume, blood lactate, and electromyography (EMG). BIOPAC’s BioNomadix research acquisition system wirelessly transmitted EMG data using two electrodes placed on participants’ right leg while they completed physical tasks.
Researchers were able find differences in the interaction effects of EMG between the two test protocols in the older group. The results complied with previous research, in that SPV allowed a higher VO2 max compared RAMP. Through monitoring physiological measurement, the study results suggested increased oxygen delivery as to an increase in oxygen-muscle extraction. The researchers found that there wasn’t a significance difference between the two testing protocols with the older population, though it’s unclear why. Overall, the experiment provides greater understanding of what causes differences in VO2 max between the two experimental procedures.
Wireless, Wearable | Quality of Life Technologies
There is a major concern growing in the medical community that the ratio of health workers to population size is decreasing. This means that the number of available doctors and medical professionals is starting to become too small to handle the number of people needing medical help. Technologies are therefore being created to help bridge the gap that is being created. These “Quality of Life Technologies” (QoLTs) have been developed to help monitor the health of people. While these technologies have been able to provide physiological support to individuals, the same could not be said for mental symptoms. If QoLTs could move into the realm of psychology and self-therapy, they could help improve the mood and quality of life for patients. A group of researchers from the Polytechnic University of Bucharest and the University of Lincoln recently published a paper that presents a machine learning approach for stress detection using wearable physiological amplifiers. To induce stress in participants, the researchers had them perform both a public speaking and cognitive task, which according to previous research these tasks caused the highest increase in measurable signals.
 For their experimental setup, they used a BIOPAC BioNomadix BN-PPGED wireless transducer, hooked up to an MP150 data acquisition system, to record both EDA and PPG signals. They then used AcqKnowledge 4 software to extract both the PPG autocorrelation signal and Heart Rate Variability (HRV). Their results provided accurate stress detection in individuals. Their analysis marks a good starting point toward real-time mood detection, which could lead to people improving their quality of life. One way they could improve their experimental setup however, would be to use the BioNomadix Logger. This device allows for up to 24 hours of high quality data logging allowing the researchers to analyze a subject’s data from when they encountered stressful situations outside the lab.

Data Logging | Lumbar Multifidus (LM) Muscle
The lumbar multifidus (LM) muscle
is an important muscle that works to stabilize certain spinal segments as well
as control the extension moment of the lumbar spine. Studies have shown that
this muscle can be atrophied in people with chronic lower back pain. Physical
therapists thus frequently use lumbar extensor strengthening or stabilization
exercises for treatment of lower back pain. Researchers are still uncertain
about the influence of surface electromyographic (EMG) activity on lower back pain treatment outcomes. Recent
research has focused mostly on EMG levels during prone trunk extension (PTE) exercises and four-point
kneeling contralateral arm and leg lift (FPKAL) exercises. These recent
studies however have not focused on the selective activation of LM muscles
during lower back pain treatment exercises.
 Jun-Seok Kim, Min-Hyeok
Kang, Jun-Hyeok Jang, and Jae-Seop Oh thus sought to study
exactly that so as to provide an experimental study that established the
efficacy of the exercises as therapeutic treatment. The researchers gathered a
group of twenty healthy individuals without lower back pain who had not participated in lumbar strengthening or
stabilization exercises during
the previous six
months. Surface EMG data was
collected from the volunteers using a BIOPAC MP150 data acquisition and
analysis system as they performed the various exercises. The study found that selective
activation was higher during the FPKAL exercise than PTE, thus showing it is
the better and more effective way to treat lower back pain. While the
experiment provides good data for evaluating therapeutic exercises, future
evaluation in an actual physical therapy setting would prove
beneficial.
Jun-Seok Kim, Min-Hyeok
Kang, Jun-Hyeok Jang, and Jae-Seop Oh thus sought to study
exactly that so as to provide an experimental study that established the
efficacy of the exercises as therapeutic treatment. The researchers gathered a
group of twenty healthy individuals without lower back pain who had not participated in lumbar strengthening or
stabilization exercises during
the previous six
months. Surface EMG data was
collected from the volunteers using a BIOPAC MP150 data acquisition and
analysis system as they performed the various exercises. The study found that selective
activation was higher during the FPKAL exercise than PTE, thus showing it is
the better and more effective way to treat lower back pain. While the
experiment provides good data for evaluating therapeutic exercises, future
evaluation in an actual physical therapy setting would prove
beneficial.
BIOPAC’s wireless BioNomadix Logger allows this type of
research to continue outside the laboratory. Subjects
who suffer lower back pain, for example, could wear the BIOPAC logging device when they are
performing PTE or FPKAL at home or during a therapeutic session.
The BioNomadix Logger’s portable
size and 24 hour data logging capability makes this type of surface EMG
recording outside the lab incredibly easy and would provide more insightful
evidence into effects of different therapeutic exercises.
Surface EMG | Musician’s Cramp

Focal hand dystonia, also known as “musician’s cramp,” is a movement disorder that causes involuntary flexing in the fingers, or finger cramps, when playing a musical instrument. This disorder poses a huge problem for professional musicians and in some cases can even threaten their careers. Many methods have been attempted to try and alleviate the ailment, but the most effective training method has been the “slow-down exercise” (SDE). This exercise, based on the fact that symptoms disappear when playing at a slow tempo, involves selecting a short passage that triggers the cramps then slowing the tempo down to where the musician can play without involuntary finger flexing. The same passage is then repeated over and over, gradually increasing the speed over time. While this method has helped improve symptoms, it was unclear what aspects of motor skills improved through SDE training.
Michiko Yoshie, Naotaka Sakai, Tatsuyuki Ohtsuki and Kazutoshi Kudo investigated how SDE affected motor performance, muscular activity, and somatosensation in a dystonic pianist. The study entitled “Slow-Down Exercise Reverses Sensorimotor Reorganization in Focal Hand Dystonia: A Case Study of a Pianist” tested a musician over a 12 month period as she underwent SDE training for 30 minutes a day, playing a specific passage that evoked the finger cramps most substantially. During the motor task, the musician’s surface EMG was recorded using EMG amplifiers and a BIOPAC MP Data Acquisition System. Throughout the rehabilitation process the musician improved her speed of key strokes and actually helped recover her normal motor and somatosensory functions. The researchers even found evidence that showed the brain had the capacity to reverse sensorimotor reorganization that was induced by the focal hand dystonia. The findings objectively show that SDE training not only improves effected people’s key strokes but helps to completely recover from the neurological disorder.
ECG Analysis | Body Dissatisfaction in University Attending Women

Weight
and body shape issues are a major concern amongst today’s general population,
especially young women. The pressure from outside forces to conform to a certain
body type, whether it is from advertisements or even their own social media
pages, is ever present. This causes a lot of women to harbor a high level of
body dissatisfaction which then internalizes aforementioned body shape
pressures. Mirror exposure has been used recently as a therapeutic technique to
reduce body dissatisfaction. Little is known, however, about what actually makes
this technique effective.
A recent study entitled “Body Dissatisfaction and
Mirror Exposure: Evidence for a Dissociation between Self-Report and
Physiological Responses in Highly Body-Dissatisfied Women” sought to study the
cognitive, mental and psychophysiological responses in women with different
levels of body dissatisfaction. Forty-two women attending University of Jaen were chosen to participate in the
study. The subjects were separated in to two groups, based on self-reported
criteria, into either the high-body dissatisfaction (HBD) or low-body
dissatisfaction (LBD) group. The participants were then asked to stand in front
of a mirror and directed to look at certain parts of their body (while wearing
beige underwear) while a BIOPAC MP150 system with an ECG amplifier continuously
recorded their physiological signals throughout the experiment. The researchers
then used AcqKnowledge software’s ECG analysis functions to obtain quantification of heart rate (HR) values. As
hypothesized, HBD women experienced more negative cognitive and mental emotions
than did LBD women. Conversely though, HBD women were found to have a reduced
physiological reaction (HR) than did LBD. The researchers hypothesized that this
might be due to HBD women’s development of a passive coping mechanism. Rather
than reacting with heightened senses to an upsetting or fearful situation, HBD
women react passively out of a possible sense of helplessness. Researchers also
felt that this could possibly be caused by HBD women performing more
self-inspections in the mirror than LBD women, but that the other explanation
was more probably. Although more research needs to be done, this study suggests
the possibility that eating behavior problems could stem from passive coping
mechanisms associated with body issues.
ECG Analysis | Physiological Changes in Response to Reporting
Physiological
responses can offer researchers key insights into the mental state of their
participants. Whereas human subjects can lie or misreport their emotions on a
self-report questionnaire, their physiological signals show the actual
truth. A quick rise in the recording
indicates a change in the subject’s emotions whether it be fear, anger, or
shame. Most studies concerning emotion shifts rely on heart rate data stemming
from ECG analysis and recording to see a participant’s reactions to the experimenters’ tests.
It is widely agreed that this is the true information that the analysis of the
ECG signal proves or disproves the study’s hypothesis. What if by simply
reporting on the emotion the researcher in fact influences changes in the
physiological response? That is what researchers Karim Kassam and Wendy Berry
Mendes sought to find out. They hypothesized that the awareness and conscious
assessment required by an individual for self-reporting of emotion may
significantly alter emotional processes. The researchers gathered one hundred
and twelve paid participants to take a series of tests designed to either induce
anger or shame (any individuals’ with depression or anxiety were excluded from
the study). Human subjects were either put into the anger, shame, or control
group and split by whether they were required to report their emotions during
the exam or not.
 Their physiological responses (heart rate, impedance
cardiography, cardiac output) were recorded using a BIOPAC MP150 Data Acquisition research system connected with
an ECG amplifier. The researchers found that in the anger group that
participant’s exhibited different physiological responses from those who were
not required to report. The shame condition however, seemed to show no
significant difference between the two groups (reporting and not reporting).
This study suggests that the act of reporting may have a substantial impact on
the body’s action to emotional situations. The data seems to point that
individuals who are provoked (anger) are likely to exhibit different
physiological responses when reporting. The knowledge that they will have to
explain their heightened emotions brings a rationale to an otherwise irrational
behavior. Shame on the other hand causes individuals to ruminate or
self-reflect, which would explain the little difference between the two
groups.
Their physiological responses (heart rate, impedance
cardiography, cardiac output) were recorded using a BIOPAC MP150 Data Acquisition research system connected with
an ECG amplifier. The researchers found that in the anger group that
participant’s exhibited different physiological responses from those who were
not required to report. The shame condition however, seemed to show no
significant difference between the two groups (reporting and not reporting).
This study suggests that the act of reporting may have a substantial impact on
the body’s action to emotional situations. The data seems to point that
individuals who are provoked (anger) are likely to exhibit different
physiological responses when reporting. The knowledge that they will have to
explain their heightened emotions brings a rationale to an otherwise irrational
behavior. Shame on the other hand causes individuals to ruminate or
self-reflect, which would explain the little difference between the two
groups.
Wireless Physiology | Psychophysiological Measures of Emotion
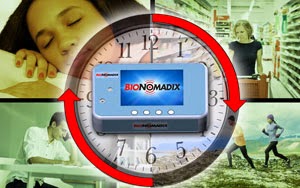
Sympathetic nervous system (SNS) activity provides objective data for
assessing emotional reactions. Electrodermal Activity (EDA) is a popular SNS
measure. EDA is basically an index of the electrical activity of the skin; sweat
glands in the skin are filled with tiny amounts of sweat and sweat contains ions
that conduct current, which can be detected and recorded. Increases in EDA
reflect increases in sympathetic nervous SNS activity. EDA is also referred to
as skin conductance (SCR, SCL, etc.) or galvanic skin response
(GSR).
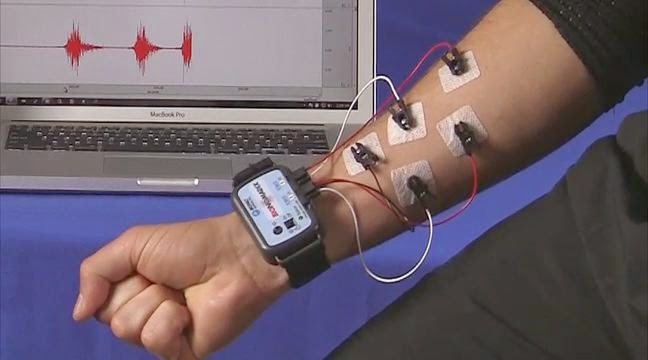 Significantly, EDA can provide time-stamped information for
moment-to-moment reaction measurement throughout a message/stimulus presentation
(such as an advertisement).Combining physiological data with self-reported data
helps provide a more complete, more accurate understanding of a participant’s
emotional reactions. Unobtrusive, wearable wireless physiology devices (such as BioNomadix
BN-PPGED from BIOPAC Systems, Inc.) can
provide continuous and precise measures of nervous system activity, such as EDA,
ECG, and RSP.
Significantly, EDA can provide time-stamped information for
moment-to-moment reaction measurement throughout a message/stimulus presentation
(such as an advertisement).Combining physiological data with self-reported data
helps provide a more complete, more accurate understanding of a participant’s
emotional reactions. Unobtrusive, wearable wireless physiology devices (such as BioNomadix
BN-PPGED from BIOPAC Systems, Inc.) can
provide continuous and precise measures of nervous system activity, such as EDA,
ECG, and RSP.
Read
a case study at “Hooked on a Feeling: Implicit Measurement of Emotion Improves Utility of Concept Testing.” Researchers conducted a message-testing study in which
they measured physiological
arousal (via EDA), emotional valence (via continuous rating dial data), and discrete
emotions (retrospectively reported emotional
reactions), among other measures. Researchers used a BIOPAC MP150 data
acquisition system and wireless EDA BioNomadix module to collect EDA while
participants viewed each ad, and a BIOPAC variable assessment transducer to
assess in-the-moment feelings of positivity or negativity. E-Prime was used to
allow for precise synchronization across stimuli presentation and data
collection.
ECG Analysis: VLPs | Data Acquisition

An electrocardiogram (ECG or EKG) is a graphical recording of the changes occurring in the electrical potentials between different sites on the skin as a result of cardiac activity. The electrical activity of the heart is a sequence of depolarizations and repolarizations. Depolarization occurs when the cardiac cells, which are electrically polarized, lose their internal negativity. The spread of depolarization travels from cell to cell, producing a wave of depolarization across the entire heart. This wave represents a flow of electricity that can be detected by electrodes placed on the surface of the body. Once depolarization is complete, the cardiac cells are restored to their resting potential, a process called repolarization. This flow of energy takes on the form of the ECG wave, and is characterized by an initial P wave, followed by the QRS complex, and then the T wave. The P wave is associated with depolarization of the atria, the QRS complex is associated with depolarization of the ventricles, and the T wave with repolarization of the ventricles. Ventricular Late Potentials (VLPs, also called Ventricular Delayed Potentials) are small-amplitude, short-duration waves that occur after the QRS complex and are precursors to cardiac arrhythmias.
Use AcqKnowledge® software to apply signal averaging on the ECG signal to detect VLPs. To perform a VLP measurement on an ECG recording, use off-line averaging to trigger on the R-wave peaks and average the time delta of 209 ms before to 200 ms after the occurrence of each peak. AcqKnowledge measurement tools can calculate the duration and Root Mean Square (rms) values of the VLPs. AcqKnowledge also simplifies other ECG Analysis with powerful, fully automated routines for use post ECG recording: use the ECG averaging function to evaluate changes in the ECG complex before, during, and after exercise or dosing; perform heart rate variability (HRV) analysis; measure respiratory sinus arrhythmia (RSA); and more... http://www.biopac.com/ecg-cardiology
EEG Data Acquisition
BIOPAC offers a
wide range of tools for recording and analyzing human or animal EEG signals.
Available hardware includes the EEG100C amplifier, which amplifies bioelectric
potentials associated with neuronal activity of the brain and can be used to
perform unipolar or bipolar EEG measurements. The amplifier output can be
switched between normal EEG and alpha wave detection. The 0.005 Hz HP
setting will support Slow Cortical Potential measurement in the EEG. The
Alpha detection mode outputs a smoothed wave with a peak indicating maximal
alpha activity (signal energy in the 8-13 Hz frequency range).
EEG can now
also be recorded from an MRI using the EEG100C-MRI smart amplifier. Data
recording is easier and final results are cleaner when using the smart
amplifier to derive EEG signals during fMRI or MRI. The unit incorporates
advance signal processing to remove spurious MRI artifacts from physiological
data. The MRI version of the EEG100C can still be sampled at the same rate as
the normal amplifier during recording. This is because the MRI related
artifacts are removed from the source, thus still leaving a perfectly recorded
EEG signal.
 The amplifier
includes a number of helpful features that improve derived EEG signals. There
is less sensitivity to electrode and transducer lead placement and improved
gain selectability. The unit minimizes computer based real-time or
post-processing signal processing for faster data analysis. Cleaner data is
available as a real-time analog output for easy analysis. The EEG100C-MRI
contains the same functionality as the normal amplifier with the added
compatibility with MRI cable and filter sets.
The amplifier
includes a number of helpful features that improve derived EEG signals. There
is less sensitivity to electrode and transducer lead placement and improved
gain selectability. The unit minimizes computer based real-time or
post-processing signal processing for faster data analysis. Cleaner data is
available as a real-time analog output for easy analysis. The EEG100C-MRI
contains the same functionality as the normal amplifier with the added
compatibility with MRI cable and filter sets.
AcqKnowledge
provides powerful EEG analysis solutions. Use AcqKnowledge software to
automatically filter raw EEG signal for Alpha, Beta, Theta, and Gamma wave
activity and provide full frequency analysis of the data. AcqKnowledge
contains powerful EEG analysis that provides a fully automated, epoch driven,
analysis of the signal. The software also will remove any EOG artifacts from
the signals.
BIOPAC also
offers a suite of wireless EEG solutions for mobile data recording. The Mobita,
BioNomadix, and B-Alert X10 units all provide powerful wireless recording
alternatives for EEG. The hardware allows for recording of EEG ranging from a
single channel to up to 32 channels of data. Combined with AcqKnowledge
software, the BIOPAC range of EEG recording products encompasses any need for
in-lab recording, real-world and MRI applications. Learn more at EEG
Applications http://www.biopac.com/eeg-electroencephalography
Data Hardware & Software Platforms
Data
acquisition hardware and software requirements vary widely based on experiment
protocol, classroom setup, field studies, etc. BIOPAC data acquisition hardware
platforms support wired, wireless, and fMRI setups, for human or animal
subjects, with powerful, intuitive data software for research and teaching
applications. Use with a variety of amplifiers, stimulators, triggers,
transducers, gas analysis modules, and/or electrodes to acquire life science
signals, including
ECG, EEG, EOG, EMG, EGG, EDA, Respiration, Pulse, Temperature, Impedance
Cardiography, Force, Accelerometry, Goniometry, Dynamometry, Gyro, and more.
Combine data hardware for multi-subject or multi-parameter
protocols.
Research hardware platforms are fully-integrated with AcqKnowledge® data acquisition software, which provides automated routines for data scoring, measurement, and reporting, and can support multiple hardware units. Teaching platforms include Biopac Student Lab software with media-rich tutorial style guide lessons for specified objectives, plus active learning options for student-designed experiments and advanced analysis.
Wired (tethered) data acquisition hardware platforms include the MP150 and MP36R Research Systems. The MP150 16-channel system with universal amplifier provides high resolution (16 bit), high-speed acquisition (400 kHz aggregate) with16 analog inputs and two analog outputs, digital I/O lines (to automatically control other TTL level equipment), and online calculation channels. The MP36R 4-channel research system with built-in amplifiers provides four analog inputs and one analog output, I/O port for digital devices, calculation channels, trigger port, headphone jack, and electrode impedance checker. The MP36R supports software-controlled amplifiers and calculation channels.
Mobita® 32-channel
wearable wireless systems are
ideal for biopotential applications that demand subject mobility and data
logging. The Mobita EEG System uses water electrodes—no skin prep or gels
required. Record live data into AcqKnowledge or log to an internal
storage card for later upload into AcqKnowledge; modes are easily
switched to suit specific protocols.
 B-Alert
X10® Wireless Systems
provide nine channels of high fidelity EEG plus ECG, and data software
for cognitive state metrics software is available. The stand-alone system easily
interfaces with MP150 Research System to synchronize with other physiological
data.
B-Alert
X10® Wireless Systems
provide nine channels of high fidelity EEG plus ECG, and data software
for cognitive state metrics software is available. The stand-alone system easily
interfaces with MP150 Research System to synchronize with other physiological
data.
BioHarness® with AcqKnowledge is a lightweight, non-restrictive data logger and telemetry system to monitor, record, and analyze a variety of physiological parameters, including ECG, respiration, posture, and acceleration.
 Stellar®
Small Animal Telemetry
Licenses with AcqKnowledge
control wireless data acquisition
from Stellar Implantable Telemetry Systems. The
easy-to-configure Animal Scheduler works for a subset or complete group of
conscious, unrestrained small animals for long term recordings.
Multiple
display modes can be viewed simultaneously, and signal conditioning tools (e.g.,
filtering and artifact removal) can be
applied.
Stellar®
Small Animal Telemetry
Licenses with AcqKnowledge
control wireless data acquisition
from Stellar Implantable Telemetry Systems. The
easy-to-configure Animal Scheduler works for a subset or complete group of
conscious, unrestrained small animals for long term recordings.
Multiple
display modes can be viewed simultaneously, and signal conditioning tools (e.g.,
filtering and artifact removal) can be
applied.
These and other BIOPAC data hardware and software solutions are used in thousands of labs worldwide and cited in thousands of publications. Learn more about research systems and teaching systems.
Research hardware platforms are fully-integrated with AcqKnowledge® data acquisition software, which provides automated routines for data scoring, measurement, and reporting, and can support multiple hardware units. Teaching platforms include Biopac Student Lab software with media-rich tutorial style guide lessons for specified objectives, plus active learning options for student-designed experiments and advanced analysis.
Wired (tethered) data acquisition hardware platforms include the MP150 and MP36R Research Systems. The MP150 16-channel system with universal amplifier provides high resolution (16 bit), high-speed acquisition (400 kHz aggregate) with16 analog inputs and two analog outputs, digital I/O lines (to automatically control other TTL level equipment), and online calculation channels. The MP36R 4-channel research system with built-in amplifiers provides four analog inputs and one analog output, I/O port for digital devices, calculation channels, trigger port, headphone jack, and electrode impedance checker. The MP36R supports software-controlled amplifiers and calculation channels.
Wireless data
hardware includes options for live or logged data:
BioNomadix
wireless, wearable physiology monitoring devices noninvasively record
high-quality, full-bandwidth data while comfortably allowing subjects to move
freely in natural indoor environments. Digital transmission and transducers
placed close to the signal source provide excellent signal quality. Record
up to 16 channels of BioNomadix data with a BIOPAC MP150 System—the system also
works with multiple MP150 systems or third-party data acquisition hardware via
an isolated power supply module.
B-Alert
X10® Wireless Systems
provide nine channels of high fidelity EEG plus ECG, and data software
for cognitive state metrics software is available. The stand-alone system easily
interfaces with MP150 Research System to synchronize with other physiological
data.BioHarness® with AcqKnowledge is a lightweight, non-restrictive data logger and telemetry system to monitor, record, and analyze a variety of physiological parameters, including ECG, respiration, posture, and acceleration.
These and other BIOPAC data hardware and software solutions are used in thousands of labs worldwide and cited in thousands of publications. Learn more about research systems and teaching systems.
End the Complications of Data Acquisition Hardware

Data
Acquisition and analysis for the life sciences has improved immensely from the
days of chart recorders and oscilloscopes. Remember when data had to be scored
by hand, and marked and measured with a ruler? The old technology of the past
has given way to sophisticated
data acquisition hardware and data
acquisition software platforms of the present day that allow researchers to
record, display, and analyze data intuitively with easy-to-use hardware and
simple pull-down software menus.
Data
Acquisition hardware is no longer complicated equipment, full of knobs, dials
and switches — rather it is easy to use, flexible and available for a wide
range of application areas. Wireless
data acquisition hardware allows of recording of mobile or ambulatory
subjects in real world environments or virtual reality paradigms. Data can be
streamed live or logged to an internal storage for later upload. Data
acquisition hardware is also available for specialty applications like fMRI,
now researchers can record
physiology in the MRI to examine subject responses during functional
magnetic resonance imaging tests.
After
acquiring physiological data, researchers can use data acquisition software
with automated analysis
routines to mark, score, and output results from the data. Data acquisition
software is intuitive and feature rich, with real-time display options,
real-time calculation channels, and post acquisition analysis tools including
cycle detectors, rate calculators, frequency and power analysis and specific
automated analysis routines for signals such as ECG, EMG, EEG, Blood Pressure,
ICG, EDA, and more!
Wireless Surface EMG Modules | Data Acquisition
Physiological
data acquisition systems offer many options for recording surface EMG, needle
EMG, and fine wire EMG. General muscle activity and fatigue can be determined
by recording and analyzing surface EMG data from major muscle groups.

Correlate
EMG activity with data from other sources including force plates, goniometers,
and motion analysis equipment. Analysis software
tools, including spike counting, muscle activation location, and frequency
analysis allow for post-acquisition surface EMG data interpretation. Results of
EMG recordings can be output as graph channels for easy data visualization, or
can be in numerical format in summary tables or spreadsheets. Data can then be
used for further statistical analysis.
Electrocardiogram Signals | ECG Analysis
 Electrocardiogram signals can be recorded
from humans or animals wirelessly or via tethered amplifiers(BioNomadix). Analyzing changes
in ECG rhythms can provide valuable insight into stress, arousal, and exercise
research. Automated ECG Analysis
packages are available that provide a wide variety of automated ECG analysis
options.
Electrocardiogram signals can be recorded
from humans or animals wirelessly or via tethered amplifiers(BioNomadix). Analyzing changes
in ECG rhythms can provide valuable insight into stress, arousal, and exercise
research. Automated ECG Analysis
packages are available that provide a wide variety of automated ECG analysis
options. To examine changes in the physical ECG complex during experimental protocols the Locate ECG Complex boundaries routine will locate and score the different parts of the ECG complex (P, Q, R, S, T intervals). The routine can be tailored for human or animal ECG recordings. For human signals, the automated ECG complex boundaries routine can also measure and extract the ECG interval information to a spreadsheet file or text file. Another automated ECG analysis routine will help the user classify heartbeats as normal, PVC, or unknown. This provides a quick automated analysis tool to identify and mark irregular heartbeats.

Additional automated ECG analysis tools are
also available to examine respiratory sinus arrhythmia, determine beat-by-beat
heart rate, and more.
Neuromarketing Solutions | Data Acquisition
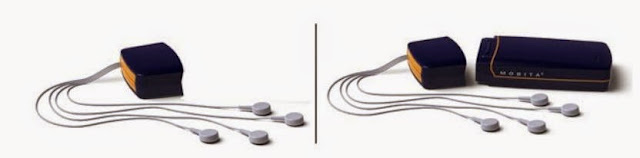
Neuromarketing solutions are available that allow you to examine physiological responses to products, environments, other stimuli or decision making tasks. Multiple physiological signals can be recorded and analyzed for Neuromarketing, including EEG. EEG analysis options allow for understanding of the subject's cognitive state for a variety of Neuromarketing tasks. Gauging level of engagement, workload and drowsiness while performing tasks or participating in consumer test situations can provide valuable insight into product development and marketing. Neuromarketing solutions should be as unobtrusive as possible, allowing for wireless EEG and other physiological signals to be recorded and analyzed from mobile subjects. Whether subjects are in a lab or real-world environment, users should have the ability to stream physiological data live or record and log up to 32-channels of high-quality biopotential data.
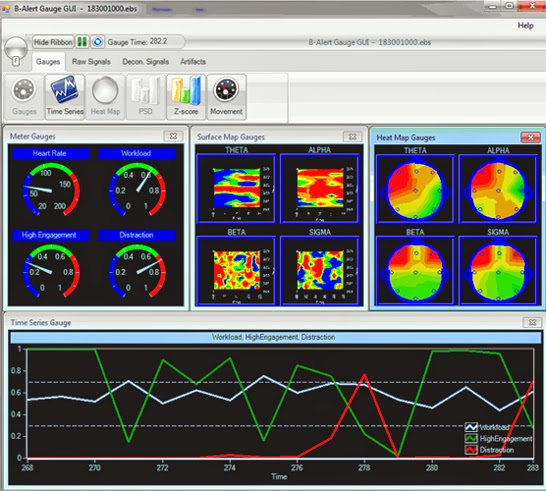
For some applications, long-term activity studies may be necessary. Solutions are available that allow users to monitor subjects in their home environment over multiple hours or days. For example, record ECG, EEG, Respiration, EMG, and GPS positioning data to look at overall activity levels and physiological responses to different Neuromarketing stimuli and daily activities that include product interactions.
Virtual Reality & Neuromarketing
Immersive
virtual reality environments can unlock physical boundaries and budget limits.
Applications
for VR protocols are varied and include Psychology, Ergonomics, Neuromarketing
& Neuroeconomics (Consumer Research), Biomechanics & Kinesiology,
Healthcare, Computer Modeling/Simulation, Education, and Training: hazard,
medical, etc.

Researchers
can immerse subjects in a VR world and record physiological data as the virtual
environment influences the subject. A feedback loop can be included for greater
control and automation of the VR world. This allows the world to change in real
time, based on the subject’s responses. Timing events are used for analysis of
the physiological data. Eye tracking can be added to the headmounted VR display
to track the subjects’ eyes as they view the immersive environment during the
experiment, and position tracking can also be included.
Wireless
transmitters, EEG caps, and eyetrackers have been used to capture data from
mobile subjects in actual environments, but virtual reality expands the research
potential by allowing participants to be immersed in variable, simulated
environments with an incredible degree of realism. For instance, neuromarketers
can allow subjects to smell and feel multiple products and move through
different display configurations, or psychologists can choose appropriate
environments to study phobias such as flying or public
speaking.
At the
first Neuromarketing World Forum
(2012, Amsterdam), the
challenge and potential of enhancing market research with neuromarketing tools
was discussed, and virtual reality immersive techniques were recognized as
valuable tools for measuring affective states while modifying product
presentation. The value of capturing
synchronized physiological data
(heart rate, HR, ECG, EDA), brain
response (EEG,
fMRI, fNIR), and behavior metrics
(eye tracking, position tracking) was also discussed.
Turnkey
VR/ Immersive systems from BIOPAC are easily combined with wireless physiology
data to synchronize VR events with physiological response data. Neuromarketers
and other researchers can record any combination of signals (ECG, EEG, EOG, EMG,
EGG, EDA, temperature, respiration, pulse, etc.) and include multimodal
stimulation with visual, auditory, olfactory, haptic, or electric stimulus.
Remote Monitoring options provide subjects with a greater degree of freedom and
allow them to move around within the virtual world.
The Body Electric | Surface EMG
Electricity
is part of everything the body does.
 Surface EMG electrodes noninvasively record the electrical activity of skeletal
muscles. The unit of measure for the electrical activity is the volt, which is named after Count
Alessandro Volta (who also invented the battery). The detection, amplification,
and recording of changes in skin voltage produced by underlying skeletal muscle
contraction is called electromyography;
the recording thus obtained is called an electromyogram (EMG).
Surface EMG electrodes noninvasively record the electrical activity of skeletal
muscles. The unit of measure for the electrical activity is the volt, which is named after Count
Alessandro Volta (who also invented the battery). The detection, amplification,
and recording of changes in skin voltage produced by underlying skeletal muscle
contraction is called electromyography;
the recording thus obtained is called an electromyogram (EMG).
Electricity
is always flowing in the body; it flows from negatively charged parts of the
body to positively charged parts. As this electricity flows, surface EMG (sEMG)
electrodes can detect and monitor the electrical activity.
Surface EMG electrodes noninvasively record the electrical activity of skeletal
muscles. The unit of measure for the electrical activity is the volt, which is named after Count
Alessandro Volta (who also invented the battery). The detection, amplification,
and recording of changes in skin voltage produced by underlying skeletal muscle
contraction is called electromyography;
the recording thus obtained is called an electromyogram (EMG).
Skeletal
muscles are stimulated to contract by somatic motor nerves that carry signals
in the form of nerve impulses from the brain or spinal cord to the skeletal
muscles. Although a single motor neuron can innervate several muscle fibers,
each muscle fiber is innervated by only one motor neuron. The combination of a
single motor neuron and all of the muscle fibers it controls is called a motor
unit. When a somatic motor neuron is activated, all of the muscle fibers it
innervates respond to the neuron’s impulses by generating their own electrical
signals that lead to contraction of the activated muscle fibers.
Integrated EMG “averages out” noise spikes in the raw EMG
data to provide a more accurate indication of the EMG output level
Muscle activation,
strength, fatigue, or twitch can be
monitored with surface EMG electrodes from a variety of body locations
to study Gait, Range of Motion, Isometric and Isotonic Contraction, Ergonomics,
startle response, etc. sEMG data can be
combined with other data to display muscle response simultaneously with other
physiological events.
Neuromarketing and Neuroeconomics | Data Acquisition

Physiological signals for macroeconomic or micromarketing analysis can be recorded almost anywhere, including: the lab, during fMRI, a workplace environment, virtual reality scenarios, in a subject's home, or mobile application. Wireless data systems allows participants to move and respond freely.
 A wide range of recording options can ensure quality data collection in a comfortable and unobtrusive manner to seamlessly capture the most important events in a neuromarketing and neuroeconomic study.
Examine responses to stimuli or decision making tasks in the brain with EEG or fNIR data. Analyze cognitive state, level of engagement, workload and drowsiness while subjects participate in a consumer test, perform a task, watch a presentation, etc.
Record a variety of biometrics to examine stress and arousal to specific stimuli, such as facial EMG, ECG/Heart Rate, skin conductance level (EDA/GSR), or respiration.
Combine eye tracking data with other physiological variables to provide context for the subject's emotional response to certain types of stimulation.

Synchronize with video to visually correlate subject’s behavior with the data...replay the video and see what the subject was doing at key points during neuromarketing study. Synchronize with GPS data to better understand a subject’s lifestyle. Create reports that classify specific and non-specific response events to specific stimuli results from automated scoring and analysis software that helps to measure, score, and output experiment results.
For more information and products surrounding this topic, follow through to BIOPAC.com.
Wireless Physiology | Data Acquisition

Research and education in the life sciences often benefits from the use of monitoring devices in which the subject being tested can move freely. BIOPAC now offers a multiple parameter ambulatory monitoring system—the BioNomadix series of wireless physiological monitoring devices.
BioNomadix
are high-quality, wireless monitoring devices that appeal to users who value
the level of accuracy that comes with wired systems, but are searching for a
data acquisition solution that enables the researcher to collect data from a
subject conducting procedures that require ample space and frequent motion.
The
BioNomadix series not only enables researchers to record high-quality data in
situations where a wired device would be limiting, it also brings comfort and
freedom to the subject. With activities such as exercising and other
high-movement tasks, the lack of wires allows the subject to conduct real-life
motions without obstruction or discomfort.
The
devices consist of a subject-worn transmitter and a receiver module.
Transmitters easily attach to any location and are used with additional leads
or transducers—short leads allow placement close to the signal source to ensure
excellent data quality. A custom, stretch mesh shirt allows multiple devices to
be worn comfortably by the subject at one time.
BioNomadix
dual-channel devices can collect data from an array of physiological signals
and signal combinations including:
ECG Dynamometry Impedance Cardiography (NICO)
EEG Respiration Electrodermal Activity
EOG Pulse Accelerometry
EMG Temperature Gyroscope
EGG Dual Strike (Heel/Toe) Goniometry/Torsiometry
Each
device is configured for the specific physiological signal type to help ensure
high-quality data at full bandwidth.
BioNomadix
wireless data sets are the latest addition to data acquisition and analysis
systems from BIOAPC that are used in thousand of labs worldwide and cited in
thousands of peer-reviewed publications.
If
you are looking for a physiological monitoring device that allows movement,
comfort and variability while still maintaining the quality, integrity and
excellence of wired devices, BIOPAC’s BioNomadix series is key to your
research.
MP150 Data Acquisition Software

AcqKnowledge is the next generation in data acquisition and analysis.
With BIOPAC Systems’ MP System and AcqKnowledge acquisition software, research is more efficient than ever. Record, organize, manage and analyze data easily with AcqKnowledge’s intuitive interface and updated features.
The MP150 Data Acquisition System includes:
- Ethernet-ready data acquisition and analysis
- Ability to record multiple channels with differing samples rates
- Function to record at speeds of up to 400 kHz (aggregate)
AcqKnowledge provides numerous video tutorials which allow you to spend less time learning the software and more time recording and analyzing data. Additionally, the system can be placed in your local area network (LAN), and you can use any PC in the LAN to record from any MP150 system in the network.
AcqKnowledge Benefits and Features
BIOPAC MP150 Systems utilize AcqKnowledge software. Some of the major benefits of AcqKnowledge acquisition software include:
- Improved lab efficiency
- Enhanced security and data integrity
- Configurable user interface
- Standard Operating Procedure (SOP) template options
New for AcqKnowledge Version 4.3
The latest version of AcqKnowledge includes several exciting updates which have made the software even more easy to use than before.
Focus Areas – This feature simplifies and standardizes data analysis by allowing you to analyze data in selected regions, as well as use it with the most automated analysis routines and the Find Cycle Detector. When you set up focus areas, you can individually label them and search for cycles on these specific regions. The focus areas can then be downloaded into separate spreadsheets. For example, when conducting automated blood pressure analysis, you can download the search baseline, test phase and recovery period focus areas separately.
Channel Specific Grid Functionality – When using grids within a data file, the grids can be enabled or disabled for different graphs. For instance, if you need a different grid for ECG and Alpha EEG waveform on the same graph, you can adjust and customize each grid. This new tool also allows you to save graph templates and presets for future use.
Linked Acquisitions – Linked Acquisitions allows you to record from multiple MP150s, MP36Rs, B-Alert Headsets and BioHarness. You can choose from multiple synchronization methods and specify whether or not to create a merged data file at the end of recording. The merged data file then will contain all of your channels of data from each recording, with independent data files for each device.
Locate Animal ECG Complex Boundaries – This new system locates and marks animal ECG complex boundaries, and functions the same way as the Locate Human ECG Complex Boundaries. However, this feature is optimized for the faster heart rates of small animals. To use the Locate Animal ECG Complex Boundaries, simply enter in the average heart rate for the file, run the routine locater and mark the ECG complex boundaries.
New Preset Options – Presets help save time on recording and analysis. Rate, expression and box configuration presets are available for both calculation channel set-up and offline analysis. When using this feature, you simply specify the number of horizontal and vertical measurement boxes desired, and then save as a preset for future use.
New User Interface Features – Version 4.3 includes many new user interface features, including tabbed window display (multiple tabs containing different tab files), textual value toolbar, selection palette enhancements, linked selections, autoscale single waveform, configure number of horizontal measurements, remove annotations from a single channel and journal docking location preference.
Pressure-Volume Loop Analysis – Baseline analysis is useful for looking at immediate drug delivery effects and when positioning a catheter. The pressure-volume loop analysis feature includes a preconfigured QuickStart template which helps you start recording quickly, and enables you to analyze pressure-volume loops data from anesthetized animals. This tool lets you easily pause recordings and run a quick baseline analysis during use, and features an intuitive loop graph display with a built-in text table.
Learn More About MP150 Data Acquisition Software
If you are interested in learning more about how the MP System and AcqKnowledge acquisition software can help you work faster and smarter, please contact BIOPAC Systems.
BIOPAC is dedicated to developing innovative, high quality and competitively priced life sciences educational and research hardware and software designed to meet customers’ needs.